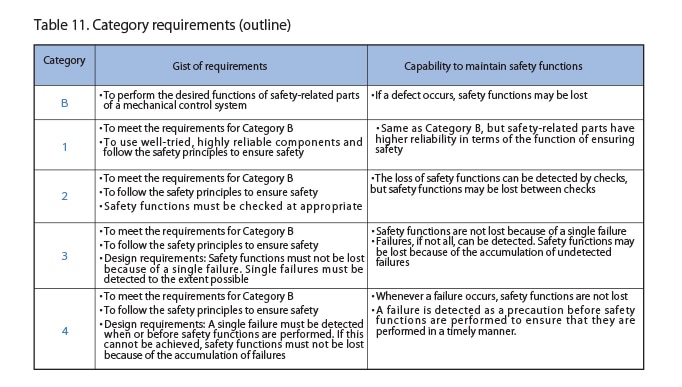
1. Order of actions and safety principles
1) Press the emergency stop switch
The output of the safety relay module turns to OFF, releasing the excitation of contactors (K3, K4), turning the main contacts (NO contacts) of the contactors OFF, and stopping the motor (hazard).
2) The emergency stop switch remains in its pressed position (latching function)
The main contacts of the contactors keep the OFF status, thus preventing the motor from unexpected star-up .
3) Reset the emergency stop switch
The action of reset itself will not start the motor.
4) Press the start switch
The motor starts.
2. Safety principles and conditions
(1) Use an emergency stop switch that conforms to IEC60947-5-5 and IEC60947-5-1 (Annex K)
(2) Use a safety relay module that conforms to PL = e and Category 4 provided in ISO13849-1.
(3) Use contactors that conform to IEC60947-1 (with mirror contacts) and arrange two contactors individually.
(4) Connect the mirror contacts (NC contacts) of the contactors to the back check circuits of the safety relay module.
3. Operating conditions of the system
(1) Operating hours/days and frequency
・Average operation days per year: 365 days.
・Average operation hours per day: 24 hours.
・Average operation frequency of emergency stop: once/day (t = 86,400 s/cycle).
(2) B10D, DC, etc. for the components
・Emergency stop switch
B10D (respective NC contacts): 100,000 cycles (as per Annex C, Table C.1)
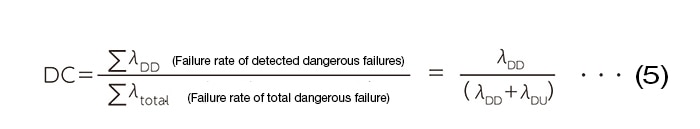
DC: 99% (as per Annex E, Table E.1)
・Contactor
B10D: 2,000,000 cycles (as per Annex C, Table C.1)
DC: 99% (as per Annex E, Table E.1)
・Safety relay module
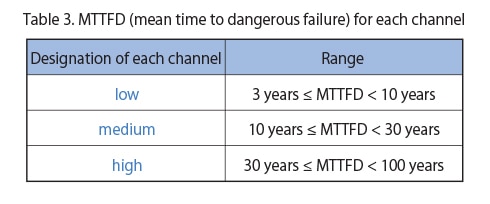
MTTFD: 243 years (the value provided by the manufacturer)
DC: 99% (the value provided by the manufacturer)
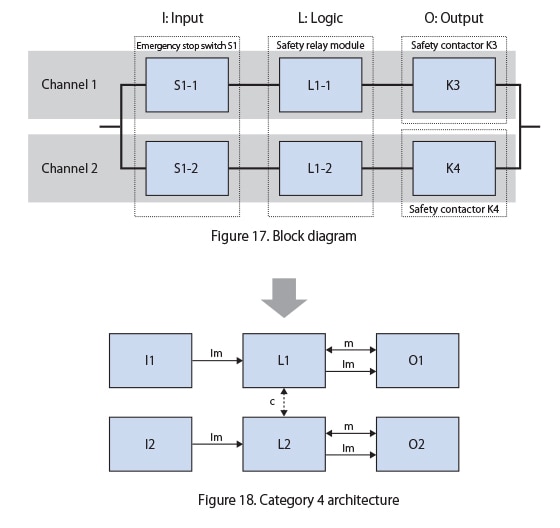
4. Block diagram
A block diagram is used to express, for example, logical connections between various sections in SRP/CS (this is based on the idea of a reliability block diagram). The block diagram can be expressed as Figure 17.
As the figure shows, this diagram is the same as the Category 4 architecture (Figure 18).
Note that in this circuit, the maximum number of operation times of the emergency stop switch is limited, and the exclusion of faults in mechanical aspects provided in ISO13849-2: 2012, Table D.8 is applied.
5. Calculation results, PL, and the probability of dangerous failure per unit time
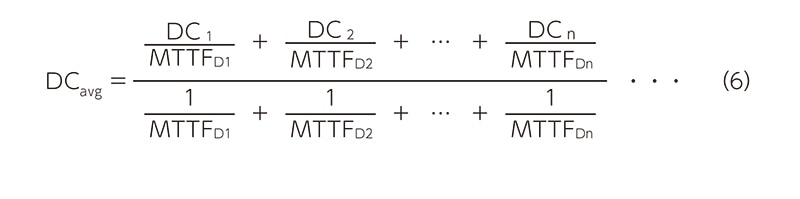
In Table 6, MTTFD, DC, and other parameters for the emergency stop switch, the safety relay module, and the safety contactors are shown on the left side, while MTTFD↓, category, DCavg, and other parameters for the system are on the right side.
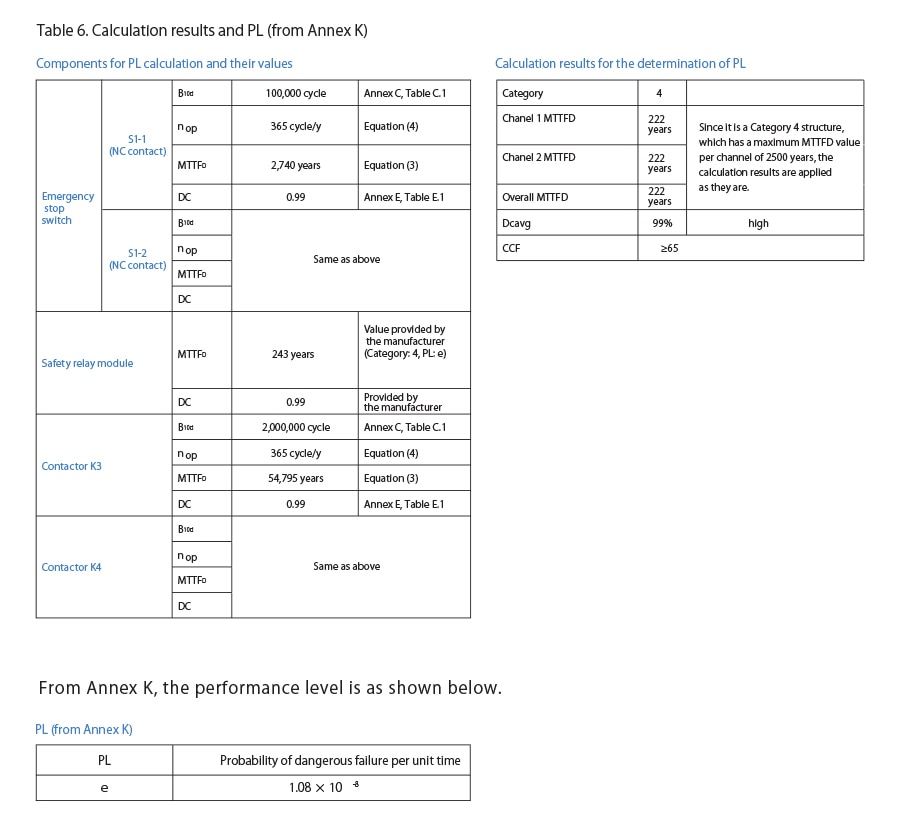
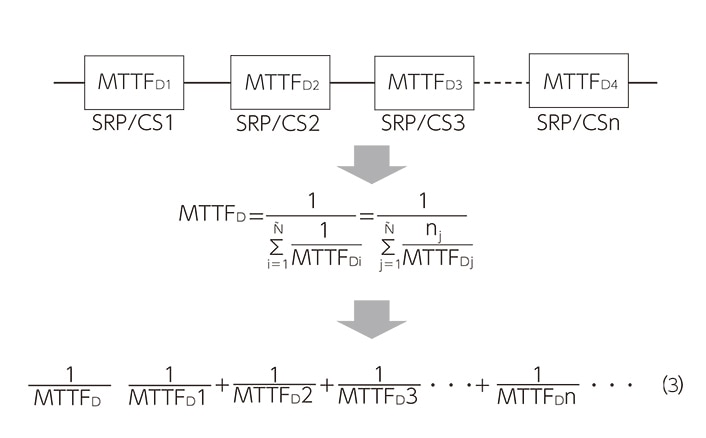
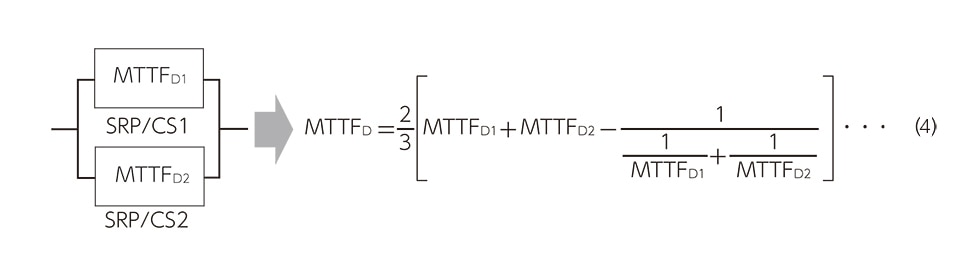
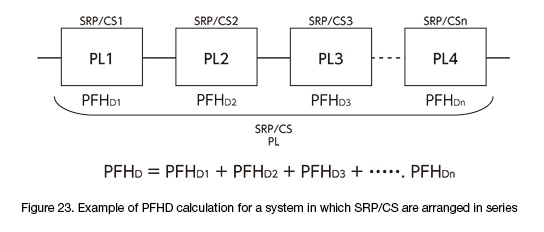
In ISO13849-1, the calculation of MTTFD was performed for each channel of the system, followed by the calculations of DCavg and other parameters. ISO/TR23849, meanwhile, adopts a method in which the entire system is divided into subsystems, PL (and PFHD) are calculated for each subsystem, and the respective values are added up to determine PL and PFHD as a whole. Described below are examples of calculations on the basis of ISO/TR23849.
In the case of limit switch × 2 units (NC contact + NO contact) + a safety relay module + safety contactors (2 units)
Please see Figure 19 for the circuit diagram.
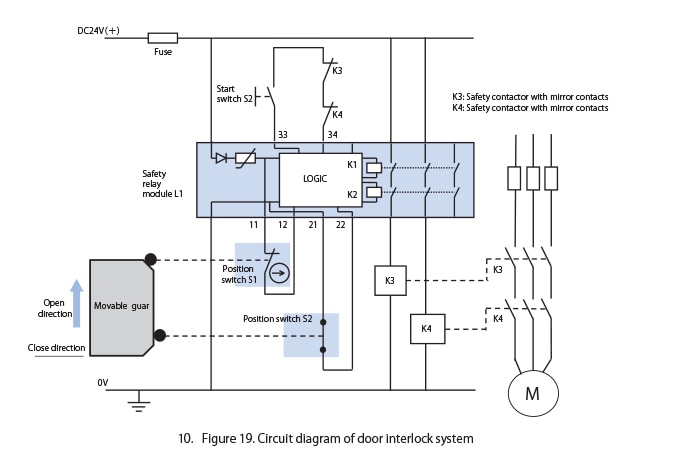
1. Order of actions and safety principles
1) Open the movable guard.
The output of the safety relay module turns to OFF, releasing the excitation of contactors (K3, K4), turning the main contacts (NO contacts) of the contactors OFF, and stopping the motor (hazard).
2) Keep the movable guard open.
The main contacts of the contactors keep the OFF status, thus preventing the motor from unexpected star-up .
3) Close the movable guard.
Just closing the movable guard will not start the motor.
4) Press the start switch
The motor starts.
2. Safety principles and conditions
(1) Position switch S1 is a limit switch with a direct opening mechanism NC contacts, and meets the requirements provided in IEC60947-5-1 Annex K.
(2) For position switch S2, use a limit switch with NO contacts.
(3) Use a safety relay module that conforms to PL = e and Category 4 provided in ISO13849-1.
(4) For K3 and K4, use products that conform to IEC60947-1 (with mirror contacts), and arrange two units individually.
(5) Connect the mirror contacts (NC contacts) of the contactors to the back check circuits of the safety relay module.
3. Operating conditions of the system
(1) Operating hours/days and frequency
・Average operation days per year: 365 days.
・Average operation hours per day: 24 hours.
・Frequency of opening and closing the movable guard: Once every 15 minutes (t = 900 s/cycle)
(2) B10D, DC, etc. for the components
・S1 limit switch B10D: 1,000,000 cycles (value from manufacturer), DC: 99% (Annex E, Table E.1)
・S2 limit switch B10D: 500,000 cycles (value from manufacturer), DC: 99% (Annex E, Table E.1)
・K3 contactor B10D: 2,000,000 cycles (value from manufacturer), DC: 99% (Annex E, Table E.1)
・K4 contactor B10D: 2,000,000 cycles (value from manufacturer), DC: 99% (Annex E, Table E.1)
4. Block diagram
As Figure 20 shows, the block diagram is expressed by dividing the system into the subsystems: the input, logic, and output.
Because ISO/TR23849 allows subsystems with the same structure to be integrated, the number of subsystems can be reduced to two as shown in Figure 21. Subsystem 1 is divided into Channels 1 and 2 to calculate their respective parameters such as MTTFD, DCavg, while PL (PFHD) is determined from Annex K, which is ultimately added to PL (PFHD) provided in K1.

5. Calculation results, PL, and the probability of dangerous failure per unit time
In Table 7, MTTFD, DC, and other parameters for the limit switch, the safety relay module, and the safety contactors are shown on the left side, while PFHD for each subsystem as well as PFHD and PL as a whole are put on the right side by referring to Annex K.


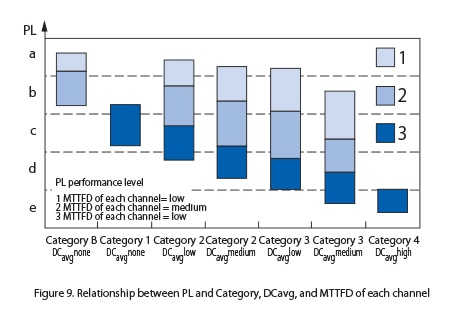 Figure 9 shows the relationship between PL achieved and Category, DCavg, and MTTFD.
 For example, when a system with PL = c is designed as Figure 10 shows, one of the Categories 1–3 can be selected for the structure (architecture).
 1) Categories B and 1
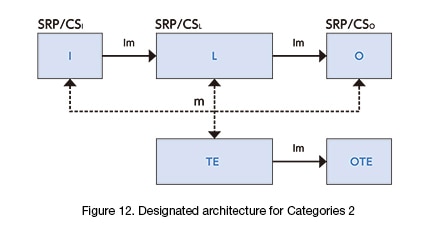 2) Category 2
 3) Category 3
 4) Category 4